Objectives with this article
The main purpose of this article is to give tips and recommendations when it comes to troubleshooting problems that the Firewall is running at high CPU load. Since there is currently no way to break down the CPU usage into the various subsystems, we have to use what available data that can be extracted from the system to try narrow down where the problem can be and hopefully find the reason and either correct it or plan for it.
And by plan for it, it means that it’s not necessary a fault somewhere but rather a capacity problem. For instance that there is a bottleneck somewhere or that the Firewall needs to be upgraded in order to handle all the data it is supposed to process.
Things change over time, what worked fine 3 years ago may not work well at all today. Clavister is also updating and releasing new functions/features from time to time that may require more CPU resources if/when these new features are activated, causing the CPU load to increase and if the hardware is not capable of handling it, it may reflect badly on the CPU load of the system. A common area that change is encryption algorithms, we are moving more and more towards stronger encryption methods and stronger encryption methods has a high likelihood to also require more power from the system.
Common reasons of high CPU load
If we look at the two most common reasons for high CPU load they are in the area of:
- Network traffic pattern.
- IPsec
Network traffic pattern
A high CPU load caused by network traffic pattern we mean that the system is processing packets in a pattern that is either expected due to increased traffic load or that something unusual is happening in the network.
An expected increase could simply be that more clients, servers, access points etc. are connected to the Firewall and is processing a much higher traffic load than what it was designed for or that additional functions and features was activated in the Firewall causing the CPU load to increase or spike due to that.
An unexpected increase would be if the normal CPU load went from e.g. 10-20% during peak hours up to 60-100% without any changes in the environment. The most common source of such an increase is a high PPS (packets-per-second) of small sized packets (below 512 bytes). This means that the Firewall could have low throughput (below 100 Mbit) but still running at high CPU because there is a lot of small packets that has to be processed. The trick would then be to try locate where these packets originate when it comes to source interface and also IP address(es). We will go into more detail about how to do that using InControl and PCAP’s further down.
A common problem / discussion that pops up from time to time is when it comes to capacity. A Firewall license can for instance contain parameters that says:
Throughput = 5 Gigabit
VPN throughput = 1 Gigabit.
But we have to keep in mind that this is under optimal conditions and not at the same time. It would be unlikely that you could get 5 Gigabit and 1 Gigabit of IPsec performance at the same time unless the hardware was over performing during its introduction (not unusual) and the license limit was set low. Also 5 Gigabit may not be possible to achieve if the processed packets are all small frames (like below 512 bytes). The smaller the packet, the less throughput we would get as we then spend a lot of time processing the packet requests instead of data. Which is one of the reasons why a DDoS attack is so difficult to stop.
Also the more functions and features that is activated (such as Anti-Virus, Intrusion detection, Web Content Filtering, IP reputation, Server load Balancing, GeoLocation etc.) the more CPU will be needed to process these functions instead of pure packet processing / performance. In the end everything has a cost that will affect the CPU load in one way or the other. For virtual Firewalls the problem may simply be that not enough CPU resources was allocated to the Virtual Firewall as more and more functions and features were activated and used.
IPsec
IPsec is very common, so common in fact that there is barely any installation of cOS Core or cOS Stream that is not using IPsec in one way or the other. The number of ways IPsec can be configured and used is also quite vast. So when a high CPU case is encountered, the chance it originates from IPsec is quite high due to this reason.
To give some examples of high CPU load related to IPsec:
- IPsec license throughput has been exceeded. The Firewall will then spend lots of CPU cyckles in order to restrict the throughput.
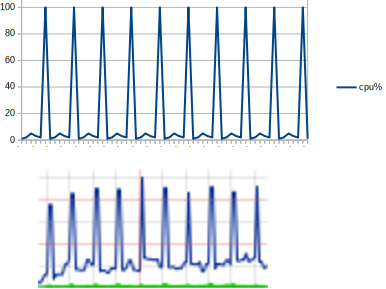
- Too high Diffie-hellman (DH) groups are used for the tunnel(s). The most common symptom of this problem is that if an HA cluster is used, it frequently makes a failover or if a standalone (or cluster) the CPU graph likes very spiky, that CPU goes up and down a lot between a low and high value.
- DH group 14-16 is still considered strong and valid to use (currently year 2020 at the time this is written). Anything above group 16 could cause CPU spikes unless the hardware is powerful enough to generate the keys needed within a reasonable timeframe to avoid network “hiccups”.
- DH group 14 is 2048 bit while DH group 18 is a whopping 8192 bit key.
- Note: DH group 19 and above is using different algorithms and will have a lower bit value, meaning higher DH groups does not neccesary mean high bit values.
- Many appliance models have crypto accelerators, but not every algorithm is accelerated. If a non-accelerated algorithm is used it would have a negative impact on performance as the main CPU then have to handle the encryption/decryption. A few examples of non-accelerated algorithms are : CAST128, Blowfish and Twofish (possibly also DES).
- Similar to problems related to traffic pattern, many of those problems can also exist in IPsec tunnels such as fragmentation, MTU inconsistencies, traffic pattern of only small packets and more.
Other less common areas/reasons
There are countless potential reasons why something that has been working fin all of a sudden start having problems with high CPU load, some more examples of situations that can trigger a high CPU load problem (in no particular order).
- Loop in the network (e.g. Switchloop)
- Machines infected by malware (e.g. became part of a botnet)
- Firewall keeps rebooting/crashing and when it comes back up, there may be some higher than normal CPU load when it attempts to synchronize with its cluster peer.
- The license limit regarding throughput or VPN throughput has been exceeded so the Firewall spends lots of CPU cycles to limit the traffic.
- Misconfigured equipment / IP conflicts / MTU problems which results in high fragmentation generation and more.
- Faults in other equipment. It could be that a firmware update in e.g. a switch has a fault that causes the traffic pattern to change or become faulty resulting in packet floods or other unusual problem(s).
- Certificates used by IPsec/HTTPS/TLS ALG etc. are part of a long certificate chain that cause the lookup to take a long time.
- Certificates used by IPsec/HTTPS/TLS ALG etc. are signed with a very strong key which cause the certificate processing to require large amounts of CPU when clients connect. This could also be an indication that it is time to upgrade the hardware.
- An excessive amount of traffic is hitting the HTTPS web admin or user authentication webpage of the Firewall. The Firewall is not a webserver and it’s processing capability of large scale HTTPS requests is not optimal (and never will be).
- An Event receiver, Mail alerting or RealTimeMonitoringAlert configuration is set to aggressive, causing the Firewall to generate a flood of events to the target system.
- An excessive amount of Intrusion Detection (IDP) signatures is used on large amounts of the traffic going through the Firewall. A review of which networks/signatures that should be used may be appropriate. A quick test would simply be to temporary disable the IDP system to see if the CPU problem originates from this feature/component.
- Currently (at this time it is not fixed in version 13.00.06) there is a bottleneck problem when using HTTPS Block pages that is generating a high amount of CPU. If this feature was recently activated and a CPU problem started happening, good chance that this feature is related to the problem.
Examining the TSF (technical support file) for clues
A good start would be to download a TSF from the Firewall(s) *when the problem is on-going * and to try search for items that stand out, is unexpected or beyond what you would normally expect. What exactly to look for can be difficult as each customer installation is unique and also to know what is not normal could itself also be difficult.
One way to try find the anomalies would be to compare two TSF files when the problem is on-going from when it is working fine (assuming of course the CPU problem is not permanently on-going). Then you can hopefully get some value insights on things that stand-out or is different from when it’s working fine.
Examining the TSF, common items to look for
The TSF contains a vast amount of information and data gathered from the Firewall using various CLI commands compiled into one file but not everything is relevant to our investigation. In order to get a general idea on things to look for, here are a few examples.
The “stat” CLI command output
Uptime : 11 days, 01:15:17
The uptime may be of interest, if very short uptime it is an indication that the system has restarted recently, unless this was done manually it could be an indication that the Firewall crashed or worst case has some sort of hardware problem (or unusual problems such as power grid spikes). If very high uptime it may be a good idea to check the available memory of the unit, maybe the Firewall has critically low memory which causes problems on some functions/features. A restart of the system could also be in place in order to see if the problem still persists after a fresh startup.
Last Event : 2020-07-08 10:41:31: Activating configuration changes
The last event is interesting as it could contains clues to the problem. The last event could for instance be a database download, a crash, a restart or even unknown reason (if you for instance power cycle the Firewall, the last event log would say <Unknown reason>. And if you can map that event to the time of the high CPU load or CPU spike, it could be a valuable clue to the problem.
CPU Load : 12%
For obvious reasons this output is interesting. But some things worth mentioning about the output.
- The value is “now”. Meaning it is not an average or other value but rather when we executed the CLI command (or initiated the download of the TSF), this was the CPU load.
- The measurement for the CPU value in order to determine what is a zero value and what is a max value is done at system startup. There have been some rare occurrences where this measurement was interrupted which could cause the measurement to be skewered. Meaning that instead of max being between 0 and 100 it becomes 40-100. So when the system it idling it looks like it is at 40% CPU load. This is rather unusual but in case you suspect that this could be the case, a simple system restart would correct it.
- Two CPU values. On some appliance models there are two values for the CPU load. The second value means that the system is using a function/feature called “poll-offloading”. Instead of the main CPU handling everything, the system has offloaded the job of polling the network interfaces to a secondary CPU. The speed which the poll-offload core does this operation is fixed, meaning that the CPU value for the poll-offload core is not really valid, instead of showing a percentage value it should simply say “On” or “Off”. So if an unusual value has been observed for the off-load Core, it can safely be ignored as it will not tell us anything of value.
Connections : 51012 out of 256000
Active connections on the Firewall could be interesting. Is the number of connections what we would expect? Is it above normal? Have we hit the license limit?
But what is normal? That is a good question that only the administrator can say for sure as each network is unique. It can be one machine that generates 10 000 connections and depending on what that machine is doing, that may be expected. It is difficult to say what is normal and what is not as it is very situational. If for instance 100 clients connect to a webpage that has lots of banners, subpages, pictures on external sources and whatnot it could be that you would see a connection burst of 100 x 150 = 15000, as generating 150 connections towards one specific webpage is perhaps a bit unusual but not entire unexpected.
Hitting the connection limit would cause an increase of CPU but from a client perspective they may not necessary notice anything at all. The effect of hitting the limit is that the Connection_replace functionality start to trigger and the Firewall will start to replace old connections with new ones. The effect can be that some clients notice that e.g. their SSH or RDP sessions break more frequently/earlier after being idle.
But if we have 10 000 connections and there is 5 clients in the network and we know they should not do anything other than normal websurf/RDP/ping etc. it is definitely an anomaly that should be looked at closer as it has a high chance of being relevant to the high CPU load problem.
Fragments : 100 out of 1024 (10 lingering)
Fragments could definitely be a source of high CPU. Fragmented packets in a networkshould reasonably be very rare, this value should optimally always be zero but if we start to see that the fragmentation buffer is exhausted (1024 out of 1024) it is a good indication that something is not right in the network. Most likely there is an MTU (maximum transfer unit) or MSS (maximum segment size) issue on either connected interfaces or individually connected machines. We have a separate how-to that goes into great details on how you can troubleshoot MTU problems, the article can be found here:
https://kb.clavister.com/324736206/troubleshoot-firewall-mtu-issues-using-wireshark
A good way to get details about what it is that is generating all the fragmented packets is to use the CLI command “Frags”, which can show you just exactly where the fragments originate and which IP’s that are involved. You can also see past / completed frags using some of the subcommands:
Done - List done (lingering) reassemblies
Free - List free instead of active
Settings related to fragmentation can be found in cOS Core under System->Advanced settings->Fragmentation Settings.
There are also attacks that are based on fragmentation. If a fragmentation attack is suspected, a way to try mitigate or lessen the impact would be to set the fragmentation buffer to zero. Which means that any incoming fragmented packet is dropped by the Firewall.
Buffers allocated  : 6349
Buffer usage       : 5%
Out-of-buffers     : 0
The various data for buffer are valuable to look at, especially the last one (out-of-buffers). The buffer value you see here are memory buffers allocated to various functions and features in the Firewall. The easiest example would be RingSizes used by the Ethernet interfaces, those take memory from this buffer value. So if you increase the RingSize buffer, you may also have to keep an eye on this value as well so you do not run low on buffers.
The Out-Of-buffers value should under good conditions always be zero. If this value increases it means that we have a problem in the network. The most common source for this value to increase is overloaded interface(s). It is not unusual for this value to increase rapidly if the system is under a DDoS attack or if perhaps there is a switch loop or other problem in the network causing the Firewall to bombarded with packets/data. More so than what the Firewall can handle on an individual interface and that the interface buffer (RingSize) is constantly exhausted.
The Out-of-buffer increase may also be observed in the CLI/serial console as the message “buffers has been flooded” in the CLI. If the Firewall buffers has been constantly flooded for more than 1 hour, the Firewall would initiate a system restart in an attempt to try recover from the problem.
Memory output:
In listing: 760056 KB
Total installed RAM: 2034 MB
Free memory        : 1248 MB
Memory in general is not a common source for high CPU problems. But one thing to keep an eye out for regarding memory is when we start to see a large inconsistency between Total installed ram, in listing and free memory. If you combine free memory with in listing you should roughly end up with the same value. A deviation up/down of 100-200 MB is not that unusual but if we start seeing a constant decrease of free memory while in listing does not increase, that is a potential memory leak in the software. If an old cOS Core version is used, an upgrade is recommended.
Please note that some functions/features allocate memory dynamically, so memory usage may increase slightly over time but should reasonably stabilize after a few days (unless of course new functions/features are activated).
Interface statistics:
When it comes to problems related to traffic patterns, interface statistics are a great source of information and will in many cases provide value clues to the problem. Output discussed here comes from the TSF which in turn comes from the CLI command “ifstat –allindepth”.
Media           : "Autonegotiated"
Link Status     : 10 Gbps Full Duplex
Media and link status is not a common problem when it comes to high CPU but rather a potential reason for poor performance. If something links in e.g. 100 Mbit half-duplex that would be a potential big bottleneck in today’s network infrastructure.
Software Statistics:
  Soft received :18990310890  Soft sent     :18798482789  Send failures :       0
  Dropped       : 2584686  IP Input Errs :       0
Software statistics basically means interface statistics from cOS Core’s perspective when it is processing traffic to/from this interface. Some sections is worth explaining further:
- Send failures: This means that cOS Core has requested that a packet be sent to the interface driver but the driver reported back from the interface that it was not possible. An example of when this would increase is if there is no cable in the interface and therefore no link is possible.
- Dropped: This means packets dropped by cOS Core. Basically anything that the firewall has decided to drop, it can for instance be due to a routing problem, no rule is triggering so it is dropped by the default_drop_rule, we have a specific drop rule for the packets, threshold rules triggered and dropped the packet, an advanced setting triggered and dropped the packet, IP reputation placed a host in blacklist and all packets to/from that host is now dropped, etc etc.
- IP input errs: This is very unusual, but it can increase when an incoming packet is dropped because the IP header is broken. Some examples of this would be: Packet too short to contain header, Wrong IP version stated in the IP header, Invalid stated header length, Invalid stated total length or Invalid checksum.
Driver information / hardware statistics:
  IN : packets=1810474643   bytes=721526290   errors= 6814669   dropped= 6814669
  OUT: packets=1618547820   bytes=368248858   errors=       0   dropped=       0
  In : Multicast pkts   :        0
  In : No rx buf        :  6814669
Even though it’s similar to the software statistics this statistical data is taken from the Ethernet driver itself. Some variations between software and hardware statistics counter is to be expected as not every packet is forwarded to the driver to be further processed.
- Errors: Errors for incoming/outgoing packets are usually part of an error category shown further down. Depending on the driver the list of error categories vary. In the above example we see that the error counter has increased and perfectly match the number dropped by the “no rex buf” category.
- Dropped: Dropped usually follows the error counter perfectly and it would be quite unusual that the interface driver would report a drop without belonging to an error category.
- Error categories: The error categories shown at the bottom of the hardware statistics can in many cases help break down why the driver reported an error/drop. In this example it tells us that the receiving buffer on the interface was exhausted so it was unable to process additional incoming packets and they were dropped.
The last one is valuable information. This is the first indicator of a potentially overloaded interface. It’s not that unusual that this counter would increase even during normal day-to-day operations, if for instance many users surf to webpages at the exact same time that would generate a big packet burst that could overload the interface. Please note that running out of the RX buffer is in itself not necessary a problem, there are installations that see an increase of this error constantly without any complaints from the users, but each packet listed here is a packet lost.
A way to help the Firewall handle these types of bursts without causing interruptions would be to increase the RingSize buffers for the interfaces. But even so, if we keep receiving more packets than what we can process during a longer time, an increase if the buffer would not help regardless of buffer size.
A DDoS would cause this buffer to increase but it could also be an indication that the interface is overloaded in general, steps may have to be taken to increase the capacity of the interface by e.g. moving networks to an additional interface, upgrade hardware to be 10 Gigabit, using link aggregation etc.
If the firewall is experiencing “out-of-buffer” increases and/or “buffers has been flooded” in the CLI, an increase here would be a good indicator of which interface(s) that are part of the problem.
IPsec statistics:
Statistics                       IKEv1  IKEv2  Total
-------------------------------- -----  -----  -----
IKE SAs active                      10      4     14
IKE aggressive mode successful     102      0    102
IKE SA negotiations active           4      0      4
IKE SA negotiations successful    1801     28   1829
IKE SA negotiations failed      278914     27 278941
IKE SA rekeys active                 0      0      0
IKE SA rekeys successful             0    327    327
IKE SA rekeys failed                 0      0      0


IPsec SAs active                    25      5     30
IPsec SA negotiations active         4      0      4
IPsec SA negotiations successful  1513     30   1543
IPsec SA negotiations failed    713741 340145 1053886
IPsec SA rekeys active               0      0      0
IPsec SA rekeys successful        6401    220   6621
IPsec SA rekeys failed               3      1      4
The last bit of information in the TSF that is interested to look at would be the IPsec statistics. Generally this is rare that this is related to high CPU problems but sometimes the problem can be a combination of many things, and if we look at the output above we see that we have a lot of failed negotiations for both IKE and IPsec SA’s. This is an indication that something is most likely hammering the firewall with failed negotiations. The most common reason for this is usually due to a mistake, a tunnel that has been configured is no longer in use but the change was not done on the remote endpoint so it is still trying to establish the tunnel constantly. Or it could be VPN clients that are configured to re-connect automatically and the user forgot that it was no longer in use.
But worst case it could be that someone is trying to brute force a tunnel by sending random proposals and keys.
Regardless, using the logs and/or the CLI command “ike –snoop” to get more details about all the failed negotiations and then block the IP’s when applicable is recommended if this kind of statistic is observed.
Using InControl Dashboards to measure PPS and BPS
A good area to continue the troubleshooting would be to use InControl’s dashboard feature. This feature has the ability to fetch real-time data from cOS Core and present statistical graphs. The data we would be interested in initially would be:
- CPU load
- PPS total
- BPS total
We initially want to see if we can map the high CPU load to an increase in PPS (packets per second) and/or BPS (bytes-per-second). If we can get graphs that shows that the CPU graph follows the PPS, BPS (or both) counter it means that the problem has a high likelihood of being related to traffic pattern.
Adding new dashboards
When adding new dashboard(s), some things to keep in mind (see picture).
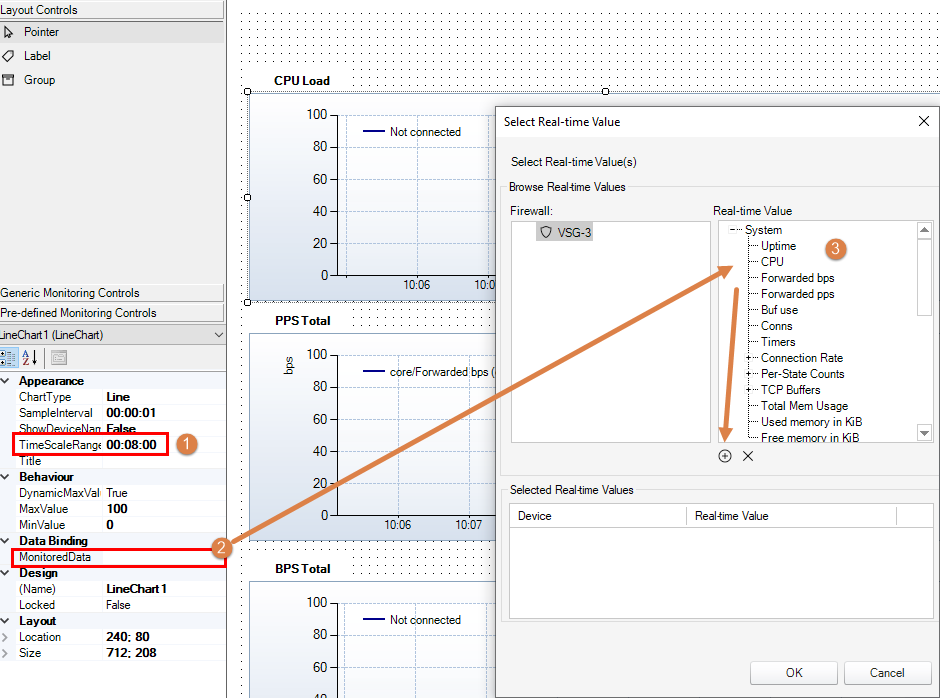
- When adding a new dashboard, make sure that the TimeScaleRange option is changed to be a longer time period. In the picture it is 8 minutes but 8 hours is probably a more reasonably time scale depending on the situation. This in case the problem does not happen at the same time of that day we need to be have a longer time scale to make sure we can get data showing the problem.
- Important: This must be done on all objects used.
- The data binding is where we select which data to monitor for our dashboard(s). Initially creating 3 dashboards in order to monitor the Core CPU, PPS and BPS is a good start.
3. Multiple values can be selected to be used on one dashboard but once we select an object, objects that cannot be combined in one dashboard will automatically be hidden and we need to remove the one(s) we selected in order to return to the big selection list again.
When we are pleased with the dashboard selections, time scale and monitored data we hit the “Run” button in order to start the dashboard monitoring. It will connect to the Firewall selected and start to compile and present the data.
Once the CPU load problem happens, we should (hopefully) based on the graphs be able to determine if the problem is related to traffic pattern on the Firewall.
Inconclusive graph output
Diagnosing CPU problems are notoriously difficult, especially of the system is already under pressure from lots of clients, tunnels etc. So an increase of PPS or BPS increase may not necessary we clearly shown on the graphs. Going from e.g. 100 Mbit to 110 Mbit is not necessary a direct link to the problem.
But we have to keep in mind that the above example of dashboard is only anexample . Breaking down the traffic even further to monitor individual interface or IPsec tunnels could be a next step. Setting up multiple monitors for Ethernet interfaces, tunnels, ALG output, pipes, IDP etc are all possible, it all depends on what is used and what is reasonable to monitor depending on how things are setup in the network environment.
Using InControl Log Analyzer for bandwidth usage queries
A very useful tool/feature when it comes to traffic analysis is the Log Analyzer in InControl. This feature has the capability of building an information “cube” of the available logs which can then be queried in order to build statistical graphs, pie-charts etc. based on the logs.
The most common and useful use of this functionality is to get information on which source IP’s that has generated the most data in the network.
The Log analyzer is explained in much greater detail in the InControl admin guide but to give a simple example of a query that could be useful for locating a high CPU problem would be the above mentioned query about who top talkers in the network.
A limitation when it comes to the Log Analyzer is to get graphs about PPS, the Log Analyzer looks at logs and based on how much data has been sent in open/closed connections a graph/table is built. Since the logs do not report packet counters we have to stick with Dashboards (or a PCAP) when it comes to getting details on the PPS rates passing through the Firewall.
A basic analyzer query
The below picture shows a query using the above mentioned bandwidth cube.
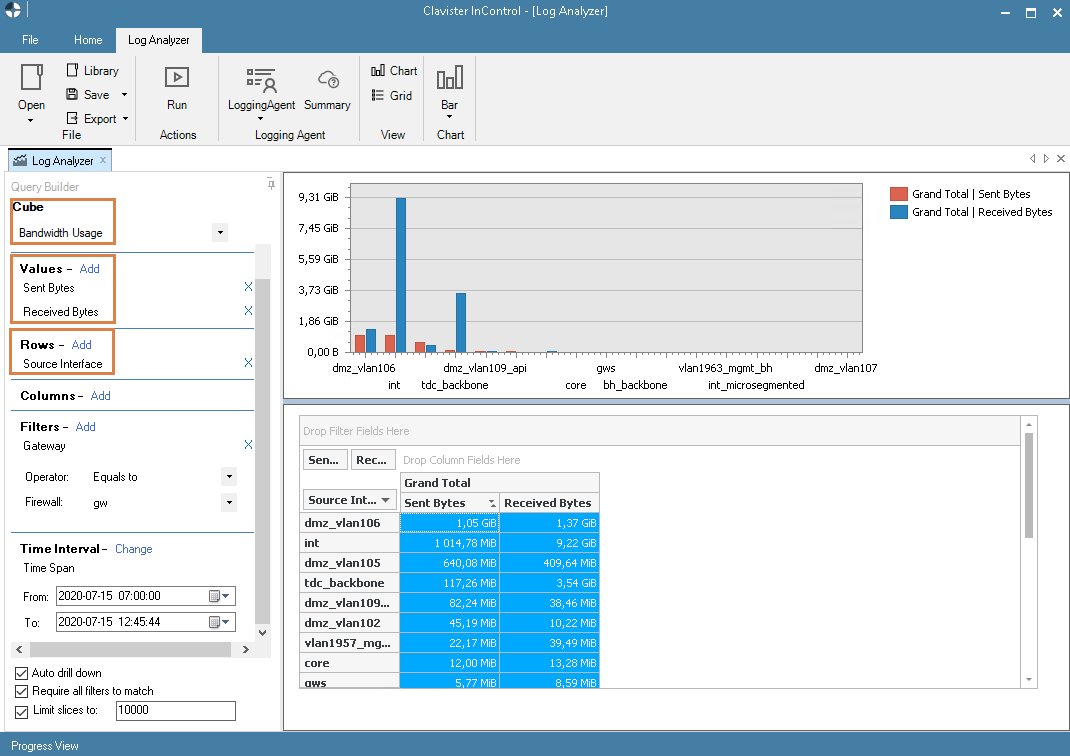
Keep in mind that this is just an example. Breaking down the data even further using e.g. protocol, user, more details time queries etc. are all methods to try narrow down the query even more surrounding the high CPU load incident(s).
Using packet capture for statistical purposes in Wireshark
A very useful tool to use to help narrow down the problem area if we suspect the problem is related to bps (bits-per-second) or pps (packets-per-second) is the packet capture functionality in the Firewall.By using PCAP we can get valuable clues regarding which interface(s) that is under heavy load at the time the problem is happening. Is it coming from the Lan/inside or Wan/Internet?
If we see that the problem seems to originate from the inside the problem could for instance be a switch loop or a machine infected with a virus.If we see that the problem seems to originate from the outside (internet) the problem could be a DDoS, DoS, virus, botnet etc.
The first step in this process is to perform the packet capture and then load the resulting file(s) in Wireshark for further examination.
Using the PCAP CLI command
PCAP’s can be run either in the CLI or the WebUI. In this case we will only go through how to use the PCAP command in the CLI as some of the more advanced options that we want to use is only available using the CLI.
An example of a syntax that we want to use:
pcapdump -start -snaplen=100 -size=20480
What this command does when you press enter after the command is to start a PCAP data gathering onALL interface, including VLAN’s, IPsec tunnels etc. The “-snaplen” parameter however means that the packet capture will only capture the first 100 bytes of each packets. This can be very effective if you are not interested in the data payload but the PPS amount and to get an overview of which interface(s) that are the busiest and then a potential source of the problem. The “-size” parameter simply increases the PCAP buffer from the default 512 KB to 20480KB (so around 20 MB). Make sure you have sufficient ram available before this command is initiated.
The resulting output from this can look something like this:
Interface       Mode     Pkts   Filter
--------------- -------- ------ ---------------------
Wan             ACTIVE    123456
Lan             ACTIVE     33520
sync            ACTIVE      2250
l2tp            ACTIVE      1920
IKEv2           ACTIVE     12400
VLAN10          ACTIVE       519
VLAN20          ACTIVE     32001
A thing worth mentioning here is that in the above example we have two VLAN’s that are attached to the Lan interface. That means that we will have packet duplication. Since the VLAN’s are going over the Lan interface you will see the VLAN tagged packets in the Lan capture as well as the untagged VLAN packets in the VLAN10 and VLAN20 packet buffer.
This is normal and nothing unusual, the idea with the first PCAP is to first see if we have any “anomalies” in the amount of packets being received on each interface.
If we for instance did not expect to see more a few packets on VLAN20 and in the test have more than 32000 packets in the amount of the time the PCAP was run, it is definitely an anomaly that we would like to take a closer look at.
A second step would then to clear the PCAP buffer and restart the sample, but this time on VLAN20 only.
pcapdump -start -snaplen=100 -size=20480 VLAN20
Once the buffer is full (or if we stop the capture manually) we save the output to a file:
pcapdump -write -filename=VLAN20.cap VLAN20
Once the file is written it can either be downloaded from the WebUI or using SCP. Downloading it from the WebUI is quite easy as the file we created can now be found in the WebUI underStatus->Tools->Packet capture.
Then we move on to the next step.
Examining the PCAP data in Wireshark
Wireshark is a free to use network analyze tool which is extremely useful when we want to examine packet captures. cOS Core generates PCAP data in a format that can be loaded directly into Wireshark. This program has many statistical functions and features that enables us to get a breakdown on the data we captured in the previous section.
Since Wireshark is a very competent program with a vast amount of functions and features we will only show a few simple examples on statistical data that may be of interest when trying to find the source of a network anomaly such as an infected host or other. To try locate something in the network that is generating an abnormal amount of PPS or BPS.
After we load our PCAP file in Wireshark we will go to the Statistics tab (not to be confused with the IPv4 statistics which we will discuss further down).
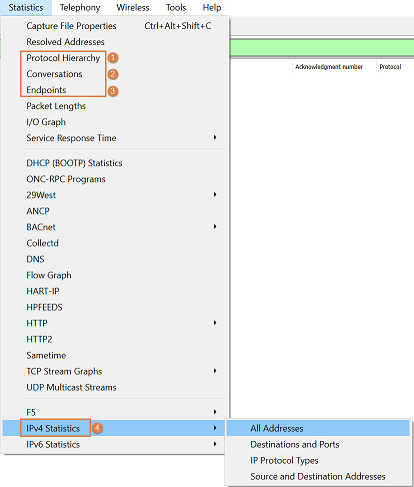
There are 4 sections here that will provide us with a good overview/information about what our PCAP file contains.
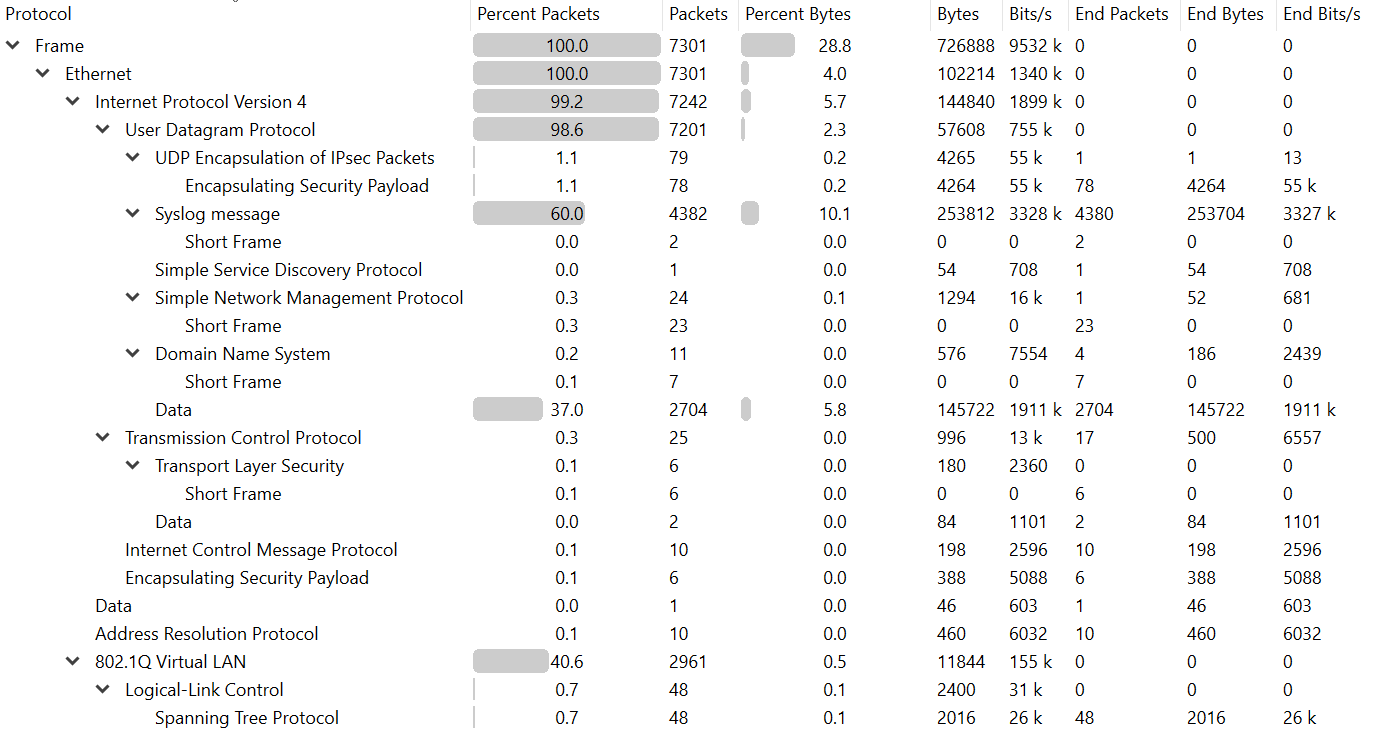
Protocol Hierarchy
This will display a breakdown of the protocols that exist in the PCAP file. In the below picture sample we have 98.6% UDP data in the PCAP. The sample PCAP was taken on a Firewall that is processing a lot of system logs to various log receivers so in this case this would be an expected breakdown of protocols.
Conversations
This is most likely the most interesting data to look at. The data here will provide us with a breakdown of which hosts that communicating/talking the most based on the PCAP. By clicking the “IPv4” and to filter on the highest number of Packets (see below) we can get a really good indicator of which hosts that are the most talkative in the network.
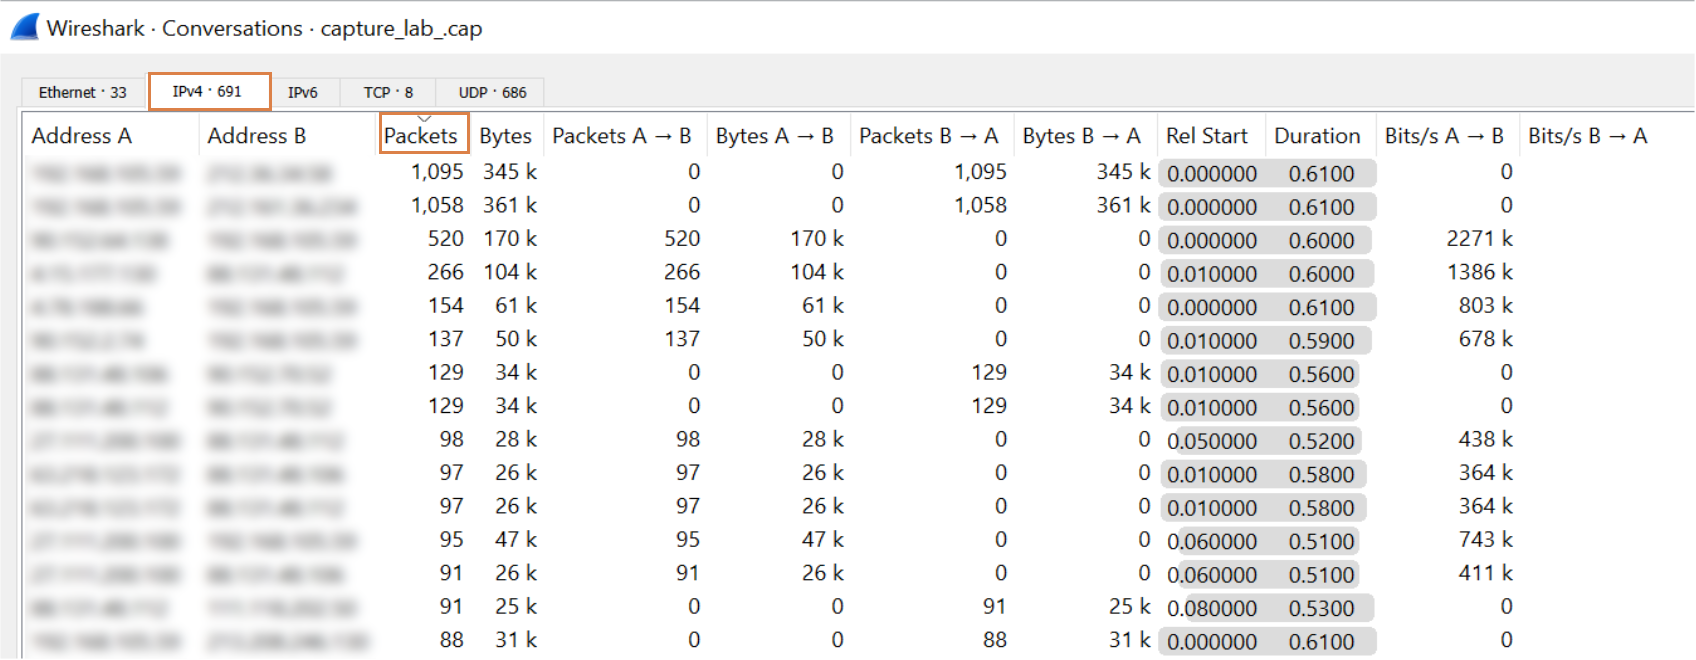
Note: The IP addresses has been deliberately obscured in the picture.
So based on the statistics, we may conclude that the top talkers in the conversation data are machines that should not behave like this at all. That would then be an anomaly and we have a really good indicator of where the problem could be in the network.
Filtering on packets is of course just an example, we may click on any other row in order to filter/change the statistical feedback in order to present the data we are interested in.
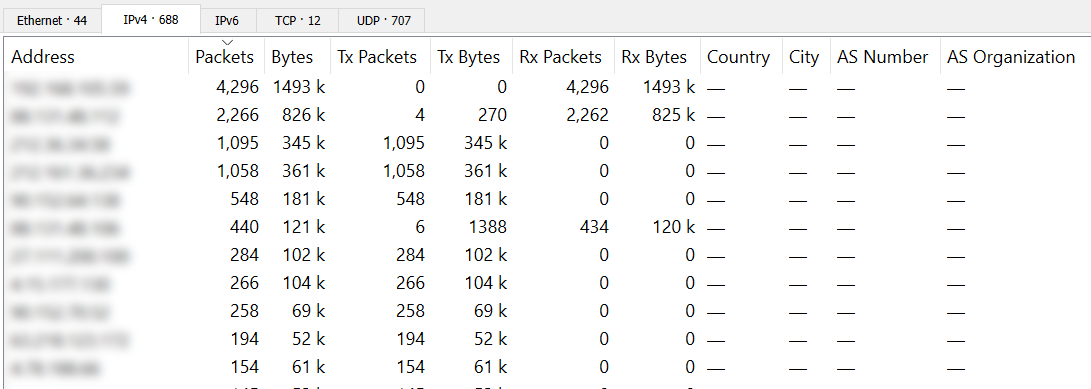
Endpoints
Endpoints is very similar to Conversations but it only shows how much packets/data that has been sent to a target host. It can be useful for the initial overview and then break it down further by going toConversations.
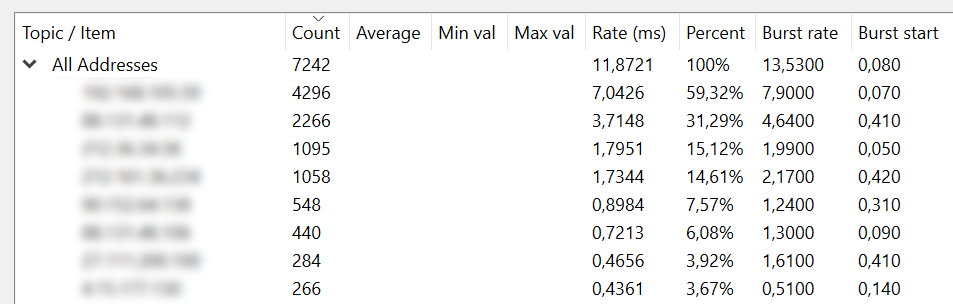
IPv4 Statistics
The last one is also similar toConversations andEndpoints but have some other details such as percentage of total data, rates and burst rates.
Conclusion of using Wireshark
Wireshark is a VERY powerful packet analyzing tool even simple things as the above packet analyzation can help significantly when trying to locate anomalies in a network. This method of finding anomalies is usually done in steps, each step in an effort to narrow down the problem further. Usually in the following steps.
A. Do a generic capture on all interfaces to see which interface(s) that seem to be generating large amount of packets.
B. Perform a new capture on the interface(s) with the highest BPS or PPS.
C. Load the packet capture(s) in Wireshark (or similar) and search the data for anomalies.
Hopefully at the end of step-C we will have enough information and details about what is happening in the network and can take the appropriate action.
Giving an example on actions to take would at this stage not be applicable as it could be thousands of different reasons based on the network design, packet flow, applications used, installed network equipment and much more.
General Q & A
Question-1: Are there any additional items that can generate high CPU load?
Answer:
This is the big question, one we have been trying to answer in the above post but there may of course be more reasons than what is already listed.
Almost anything can generate high CPU loads depending on how the Firewall is used & configured. E.g. if we configure pipes with limit to 10 Mbit on a 10 GBit interface it would most likely cause the Firewall to spend a lot of it’s CPU cycles trying to limit the flood of packets that was received on the 10 GBit interface. Logging enabled on stateless rules, loopback interface that loops to itself, DHCP server with 1 IP in the pool, IPv4 or IPv6 network conflicts, switchroute loops, incorrectly configured virtual switch. The list can go on and on pretty much forever.
High CPU loads is not always an exact science, but hopefully this guide will help narrow down the problem areas in order to find the root cause of the problem.
Question-2: Is there any additional monitoring that can be setup regarding high CPU loads other than the WebUI and InControl?
Answer:
Besides the WebUI and InControl, there are at least 3 other features/functions that can be used to monitor and/or inform the administrator if/when a high CPU situation has occurred.
- Real-time monitoring alerts.
Configure a customized log message that can inform the administrator if/when a certain CPU threshold has been reached. E.g. generate this log if CPU load is above 70%. It will be up to the administrator to then configure something that can react if/when such a log entry is generated/triggered. - SNMP
Query the Firewall using an SNMP tool in order to get information about Firewall status, including CPU load. Systems like Cacti is using SNMP to build health/status graphs. - InCenter
InCenter is a separate Clavister software product. InCenter provides an intuitive graphical client which is accessed through a standard web browser for managing and analyzing multiple firewalls via a server. The InCenter server can be running on on-premises hardware or it can be accessed as a cloud service provided by Clavister.
InCenter mainly uses the Firewall logs to build statistics and graphs. Special telemetry logs are generated every 5 minutes which contains information about (among other things) the CPU load.
Question-3: I’m still having high CPU load even though I’ve gone through all of the above steps, what do I do?
Answer:
At this stage it may be best for you to contact Clavister support in order to get help with further troubleshooting. If that is the case, please document what you have done so far in your troubleshooting in order avoid having to discuss some of the points you may have already done/checked.
Related articles
15 Apr, 2025 core troubleshoot
15 Apr, 2025 core troubleshoot
15 Apr, 2025 core troubleshoot
15 Apr, 2025 core troubleshoot
18 Mar, 2024 onetouch sslvpn oneconnect troubleshoot certificate
4 Aug, 2023 core ipsec troubleshoot ike
28 Oct, 2020 core howto ethernet packetloss cpu
15 Apr, 2025 core troubleshoot
7 Dec, 2022 ipsec ike troubleshoot core
15 Apr, 2025 core troubleshoot
15 Apr, 2025 core troubleshoot
15 Apr, 2025 core troubleshoot
17 Mar, 2026 core troubleshoot cluster ha
15 Apr, 2025 core troubleshoot