Introduction
When administering a NetWall firewall over a period of time, there can often be a natural accumulation of entries in IP rule sets and it can become difficult to know which entries are actually being used. There are two methods for retrieving this information from the firewall. One method uses InControl and the other uses the cOS Core CLI. Both are described in detail below.
Method 1 - Using the “Rules Monitoring” option in the InControl client
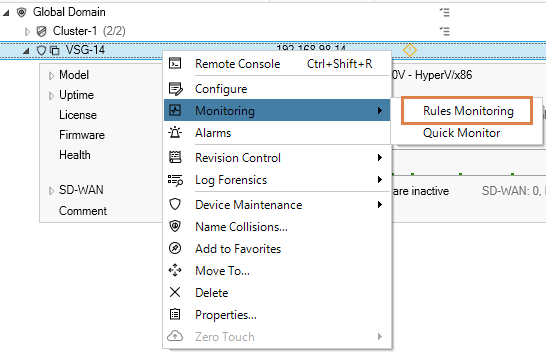
The first method is to use an option in InControl (version 3.15.00 and later) which is called “Rules Monitoring”. The location of this option in the client interface is under the Monitoring sub-menu in the context menu displayed in the Firewalls tab for each firewall. This is shown in the screenshot below (the option can also be accessed using the toolbar ribbon at the top).

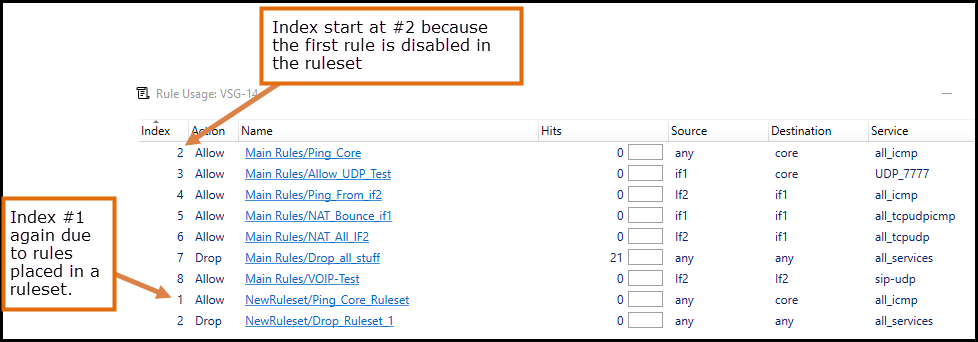
Selecting this option causes InControl to connect to the target firewall (or firewall node if a cluster) and extract data on how many times rule set entries have triggered since the last system start up The screenshot below shows an example of the output.

In the above output, the administrator can choose to sort on any of the columns. Probably the most interesting column to sort would be the Hits column where the least amount of hits is placed at the bottom.
There are several points worth mentioning regarding this output:
- The number of hits (triggers) is the total since the last firewall start-up.
- For HA clusters, it is recommended to use the Rules Monitoring option on the node that has the longest uptime and has been the most active. The CLI commands "stat" and "ha" can be used to determine which node would be the most suitable.
- The "Reset Statistics" button at the bottom of the output only resets the statistics of what is displayed. It can be useful to see rule usage at a given point of time. If the rules monitoring output is closed and opened again, the historical data will be re-fetched from the firewall by InControl.
- In InControl version 3.17.00 and later, the additional option exists to export the rules monitoring output into a CSV file.
- The index number may look strange but that is due to how the firewall indexes objects. See the image below below for two examples and explanations as to why the index seems to restart.

Method 2 - Using the “rules” CLI command
The second method is to use the cOS Core CLI with the command:
rules -verbose
By default, this will only list the entries for the <main> IP rule set. If more than one rule set exists, the following command can be used to get similar output for a specific named rule set.
rules -verbose -type=IP -ruleset=<my-rule-set-name>
There are several things worth mentioning regarding the output from the rules command:
- The output from the command is "runtime data", which means it includes active and deployed changes
- It is dissimilar to the InControl method in that the output does not include additional rule sets or disabled entries in the indexing
- The indexing may look very different to that shown by InControl. An example might be that InControl shows we have 20 entries, but the output from the CLI command shows 24. The reason for this is that a single entry (such as an IP Policy) may create multiple linked IP rules that are shown by the CLI but not by InControl. An example would be an IP Policy with a SAT translation. Depending on how this policy is configured, it could create three IP rules in the background. This is why indexing may look quite different when using the CLI command. If an IP Policy creates associated IP rules, they all have the same name, so it is possible to identify these linked entries.
Q & A
Is it safe to remove an IP rule set entry with zero hits?
This will be a decision for the administrator. The longer the uptime of the unit the better the data is, so if a rule has zero hits and the firewall has 100+ days of uptime, it seems fairly safe to conclude that this rule is no longer triggering or is perhaps configured in such a way that it is not functioning. If unsure, the first step would be to disable the rule, and if there are no user complaints or other issues for some time, delete it.
Tip: Before disabling an IP rule set entry, make a comment in the entry’s comment field of the date when it was disabled.
The IP rule set entry has zero hits when many were expected, what is wrong?
The most likely causes of such a problem would be:
- The rule is not configured correctly so the criteria for it to trigger were not fulfilled.
- Another rule triggers before this rule. An IP rule set is read from the top to the bottom so carefully examine any rule set entries placed above the entry in question. Some higher entry may be triggering first.
A Stateless Policy that was created some time ago has an enormous amount of hits compared to other entries, is this a potential problem?
A stateless rule set entry (as the name implies) does not create an internal state in cOS Core (in other words, no connection is created in the state engine). This means that for stateless entries (including FwdFast IP rules) every packet in relevant traffic can trigger a matching rule set entry. So instead of one hit per connection attempt, it would be one hit per PACKET. This is not unexpected and the way stateless rule set entries should work. However, it is recommended to avoid using stateless rule set entries as much as possible since they demand greater firewall resources which could impact performance.
Related articles
26 Apr, 2023 core rules
2 May, 2023 core rules schedule applicationcontrol
26 Jan, 2023 core rules transpose
7 Oct, 2025 core rules
8 Sep, 2020 core ipsec rules access
17 Mar, 2023 core routing rules ping icmp cli