The packet capture tool
Sometimes a NetWall firewall networking problem is not possible to solve with some of the basic cOS Core tools available, such as logs and CLI output. Packet capture may become necessary to find the cause of strange network behavior. The cOS Core “pcapdump” CLI command (and its WebUI equivalent) is a tool that can perform capture of packets traversing the firewall and also provide them in a file format which can be read by external analysis tools, such as Wireshark. This article will provide insights and tips on how to best perform packet capture in cOS Core.
A basic packet capture example using the CLI
Below is an example of a typical CLI command sequence that might be used for capturing packets:
pcapdump -start lan -port=80 -ip=10.10.10.10 -size=1024
<capture required data>
pcapdump -stop
pcapdump -write lan -filename=lan.cap
pcapdump -write dmz -filename=dmz.cap
<download pcap files>
pcapdump –cleanup
The above sequence uses the most common pcapdump filters which are IP and/or port. It is possible to use other, less common filters as well, such as different protocols and MAC addresses.
A common packet capture mistake
A common mistake when capturing packets is to filter directly on source or destination IP, or port. This means that if we want to catch the entire conversation/communication between the client and the server, we will only see half of the conversation. That may be useful depending on the situation but it can also cause problems. More on that later.
The choice between using the CLI and WebUI
The choice of using the CLI or WebUI to perform capture will be up to the administrator. For basic captures, the WebUI could be sufficient but more advanced captures will need to be performed using the CLI as not all options are available in the WebUI. This article will focus primarily on the CLI.
Using the pcapdump CLI command
Let us say we want to perform a packet capture where we filter on the IP address 192.168.1.50, which is a client located behind the Lan interface. The client wants to reach a server located behind the Dmz interface with IP 10.10.10.200.
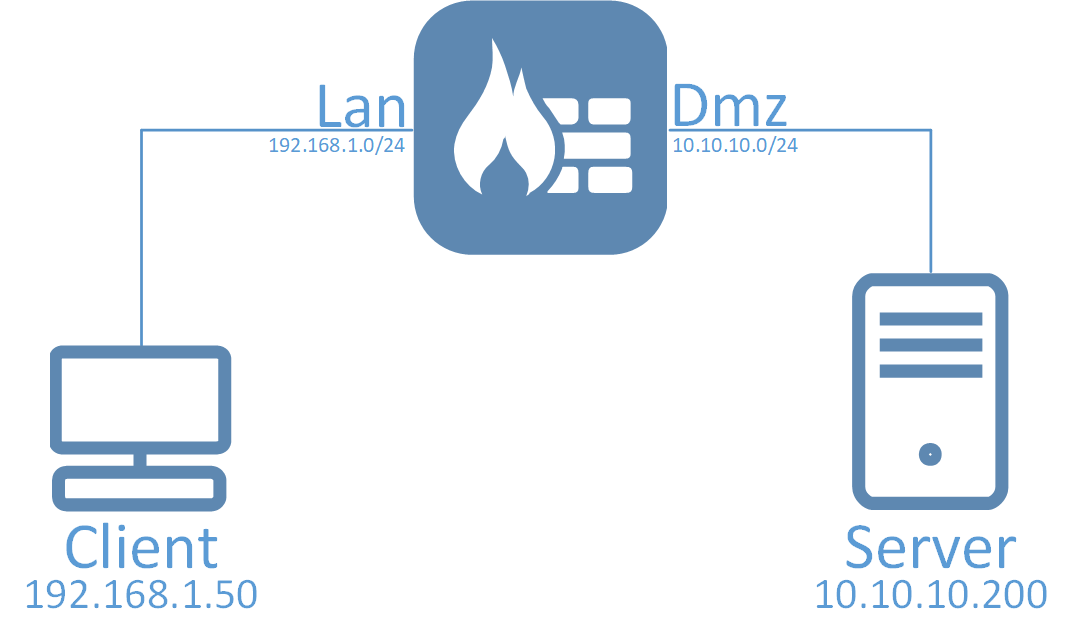
Both of these IP addresses are private IP addresses used in the internal networks routed behind the firewall. There are some problems between these hosts and we want to see more clearly what is going on between them. They can communicate with each other using IP policies that do not have any address translations configured.
When using pcapdump we, in most cases, want to set a filter. Since we want to see the traffic that is initiated from 192.168.1.50 to 10.10.10.200 we can set the following filter:
pcapdump -start -ipdest=10.10.10.200
If we were to start the capture, we would get all packets going to 10.10.10.200, but note that it will only be packets sent TO 10.10.10.200, not FROM. This is because we filter on the destination IP address only. Depending on the situation this may be enough, but not in our example as we want to see the whole conversation both TO and FROM 10.10.10.200.
A better filter to use would be:
pcapdump -start -ip=10.10.10.200
Note: Since we did not define the interface, the above packet capture will be started on all available interfaces.
Now, we will get both the source and destination packets to 10.10.10.200. But this is towards the server, if the problem is only for this specific client, a better filter would be to filter on the client:
pcapdump -start -ip=192.168.1.50
In this scenario we know that this client and the server are exchanging a lot of data. Since our problem is with HTTP only, it might be a good idea to try narrow down the packet captures as much as possible so setting a port filter for HTTP traffic is a good idea:
pcapdump -start -ip=192.168.1.50 -port=80
Same thing here, we can use source or destport but since we want to see both the question and the reply, we apply the parameter “-port=80” which means both source and destination. Note that the filter expressions must be included in the same command line.
When the above command has been executed the packet capture will be started on all available interfaces. If we want to restrict the capture to only be performed on our Lan and Dmz interfaces, we can format the command like this:
pcapdump -start Lan,Dmz -ip=192.168.1.50 -port=80
By default, the memory buffer for a packet capture is 512kb. Depending on what the administrator wants to capture, this may be enough but there can be scenarios that require the buffer to be increased significantly. To increase the memory buffer the option “-size=<Value in kilobytes>” can be added to the command syntax:
pcapdump -start Lan,Dmz -ip=192.168.1.50 -port=80 -size=1024
We now attempt to reproduce the problem in order to get the problematic traffic caught in our packet capture buffer. Once the problem has been reproduced, we stop the capture:
pcapdump -stop
Note: Packet capture will always stop automatically once the buffer is full.
Now we have a capture buffer that only exists in the memory of the firewall. The “pcapdump” or “pcapdump -status” commands can be used to see the current status of the capture. We can write the current buffer contents to a file on the firewall disk media using the -write option and this can include filters:
pcapdump -write lan -filename=lan.cap
pcapdump -write dmz -filename=dmz.cap
An alternative command would be to simply type:
pcapdump -write
The firewall would then automatically create files for each interface. In the above example, the names would be “lan.cap” and “dmz.cap”.
This is extremely useful when trying to determine where the problem is. Is it on the client side or the server side? Or is it perhaps after packets passed the firewall in either direction? Having the captures separated by interface is an easy way to see relevant information. It is, however, not possible at this time to write captures from both Lan and Dmz in the same file.
This example used IP and Port only, but there are other filter expressions which will be discussed in the next section.
Downloading the resulting capture files
Once we are done with the packet captures, the generated files need to be downloaded and then analyzed (for example, using Wireshark). The files can be downloaded using either secure copy (SCP) or using the WebUI under “Status->Tools->Packet capture”. It is possible to generate the capture data using the CLI and then download the resulting files using the WebUI. More information on SCP and how to download the capture files can be found in the cOS Core Administration Guide.
When address translation is involved
When address translation is involved (such as NAT for outgoing traffic) you may not get the results you expect if you filter on, for example, the client’s source IP. The reason for this is that the source IP of the client changes when it leaves the firewall after address translation.
This needs to be taken into account when performing packet captures, so the IP of the client may not be a good filter. With NAT, the filter should probably be the destination server (assuming you know the address and that it is not multiple addresses) or the port. If the amount of traffic is not excessive, this should work.
Another alternative is to temporarily give the client a public IP address and avoid translation when performing the capture.
Clearing the memory buffer and deleting any capture disk files
When you are finished with a packet capture and the needed files are downloaded from the firewall, there is no reason to keep the memory buffer and/or capture files on the firewall disk media. Use the following command to wipe both the memory buffer and the files.
pcapdump -cleanup
Note: This will clear all PCAP data written to the firewall media disk and also clear the memory buffer.
Advanced pcapdump options
The pcapdump command is very powerful. Going beyond basic scenarios, we will look at some of the other command options that can be very useful to know about.
Capturing output directly to console window
The “-out” and “-out-nocap” options can be useful if we want to perform capture for a limited number of packets, without the need to write the files. These options mean that we dump captured packets directly on the console whenever they are received on the selected interface(s). The difference between “-out” and “-out-nocap” is that “-out” also writes the captures to the memory buffer while “-out-nocap” only adds the output to the console window. The latter is the one most commonly used.
Warning: These options can be hazardous to use unless capture is properly filtered or a count limit is set, since we risk flooding the console. In the worst case, that could lead to an unreachable system.
Here is a syntax example showing how some of these options are used.
pcapdump -start -ip=1.2.3.4 -out-nocap -count=5
It is strongly recommended to always combine “-out” or “-out-nocap” with the “-count” option as the count option stops the packet capture automatically after a set number of packets. This prevents flooding.
Note: Output directly to console will not contain as much detail about packets as when saving to a file. It is useful for quick testing if we are mainly interested in such things as if we receive a reply to a SYN or Echo Request packet, or perhaps with MAC address related troubleshooting.
Viewing data in already captured memory buffer
If we have capture data stored in memory, we can view this data using the “-show” option. For example:
pcapdump -show Lan -num=15
The “-num” flag will show the first 15 packets in the packet capture. It is recommended to use the num flag when running this command in order to avoid flooding the console if there are a large number of packets in the buffer (for example, 100,000).
Note: The “-show” output will list packets in the order they were received, regardless of the interface. This means that if we have in the capture buffer packets both from the Lan and Dmz interfaces, the “-show lan -num=15” output might show only 5 packets instead of 15 because the other 10 packets were received on the Dmz interface. In other words, do not get confused if the “-num” output does not show the exact number of packets specified by the “-num” option.
A useful tip about limiting per packet data
One of the most useful options in the pcapdump command is “-snaplen=<value>“. Here is a syntax example for this option:
pcapdump -start Lan -snaplen=100
This option limits the amount of data captured for each packet. So the above example with 100 specified means that we only capture the first 100 bytes of all received packets. If we have a situation were we want to see conversations between hosts on the local network in terms of PPS (packets-per-second) we would not care about the data in each packet, only the Frame and Header would matter. By using this option, we are able to capture a lot more packets before the buffer gets full and have much more data to analyse when it comes to host conversations and PPS.
Of course 100 bytes is quite low. If we actually want to see the data in the packet, not even an ARP request would fit into this 100 byte limit (Frame 60 bytes, header 32 bytes and data 28 bytes = 120 bytes).
Related articles
4 Apr, 2023 core pcap pcapdump wireshark